Onehive Africa Investment Platform
Dual dashboard system empowering investors to track their impact investments and enabling admin teams to manage operations across Africa's beekeeping ecosystem.
Executive Summary
Onehive Africa connects investors with beekeepers across Africa, creating a platform for impact investment that generates financial returns while promoting environmental conservation and rural economic empowerment.
We designed the website and two interconnected dashboard systems: an Investor Dashboard providing portfolio tracking, ROI analytics, and impact visualization, and an Admin Dashboard enabling the internal team to manage investments, monitor farmer progress, and oversee platform operations across multiple African countries.
The Challenge
Building trust through transparency while managing complex operations
Complex Data for Multiple Users
Investors needed clear visibility into their portfolio performance, while admin teams required comprehensive tools to manage hundreds of investments, farmers, and partners across multiple countries.
Trust & Transparency
Building investor confidence required real-time tracking, clear ROI projections, and transparent reporting on both financial returns and social/environmental impact metrics.
Dual Dashboard Requirements
Creating two distinct but cohesive dashboards-one optimized for investor decision-making, another for internal operations-while maintaining design consistency and usability.
Impact Visualization
Communicating the triple bottom line (financial, social, environmental) in an engaging, understandable way that motivated continued investment and showcased real-world outcomes.
Our Approach
A systematic process from research to launch
User Research & Journey Mapping
Conducted stakeholder interviews with investors and admin teams to understand pain points, created personas, and mapped user journeys for both dashboard experiences.
Information Architecture
Designed data hierarchies and navigation structures tailored to each user type, prioritizing key metrics and actions for investors vs. operational controls for admins.
Dashboard Prototyping
Built interactive prototypes for both dashboards, iterating on data visualization approaches, layout patterns, and interaction models through multiple user testing rounds.
Visual Design & System
Developed a cohesive design system with emphasis on data clarity, created custom charts and graphs, and established color coding for investment statuses and impact metrics.
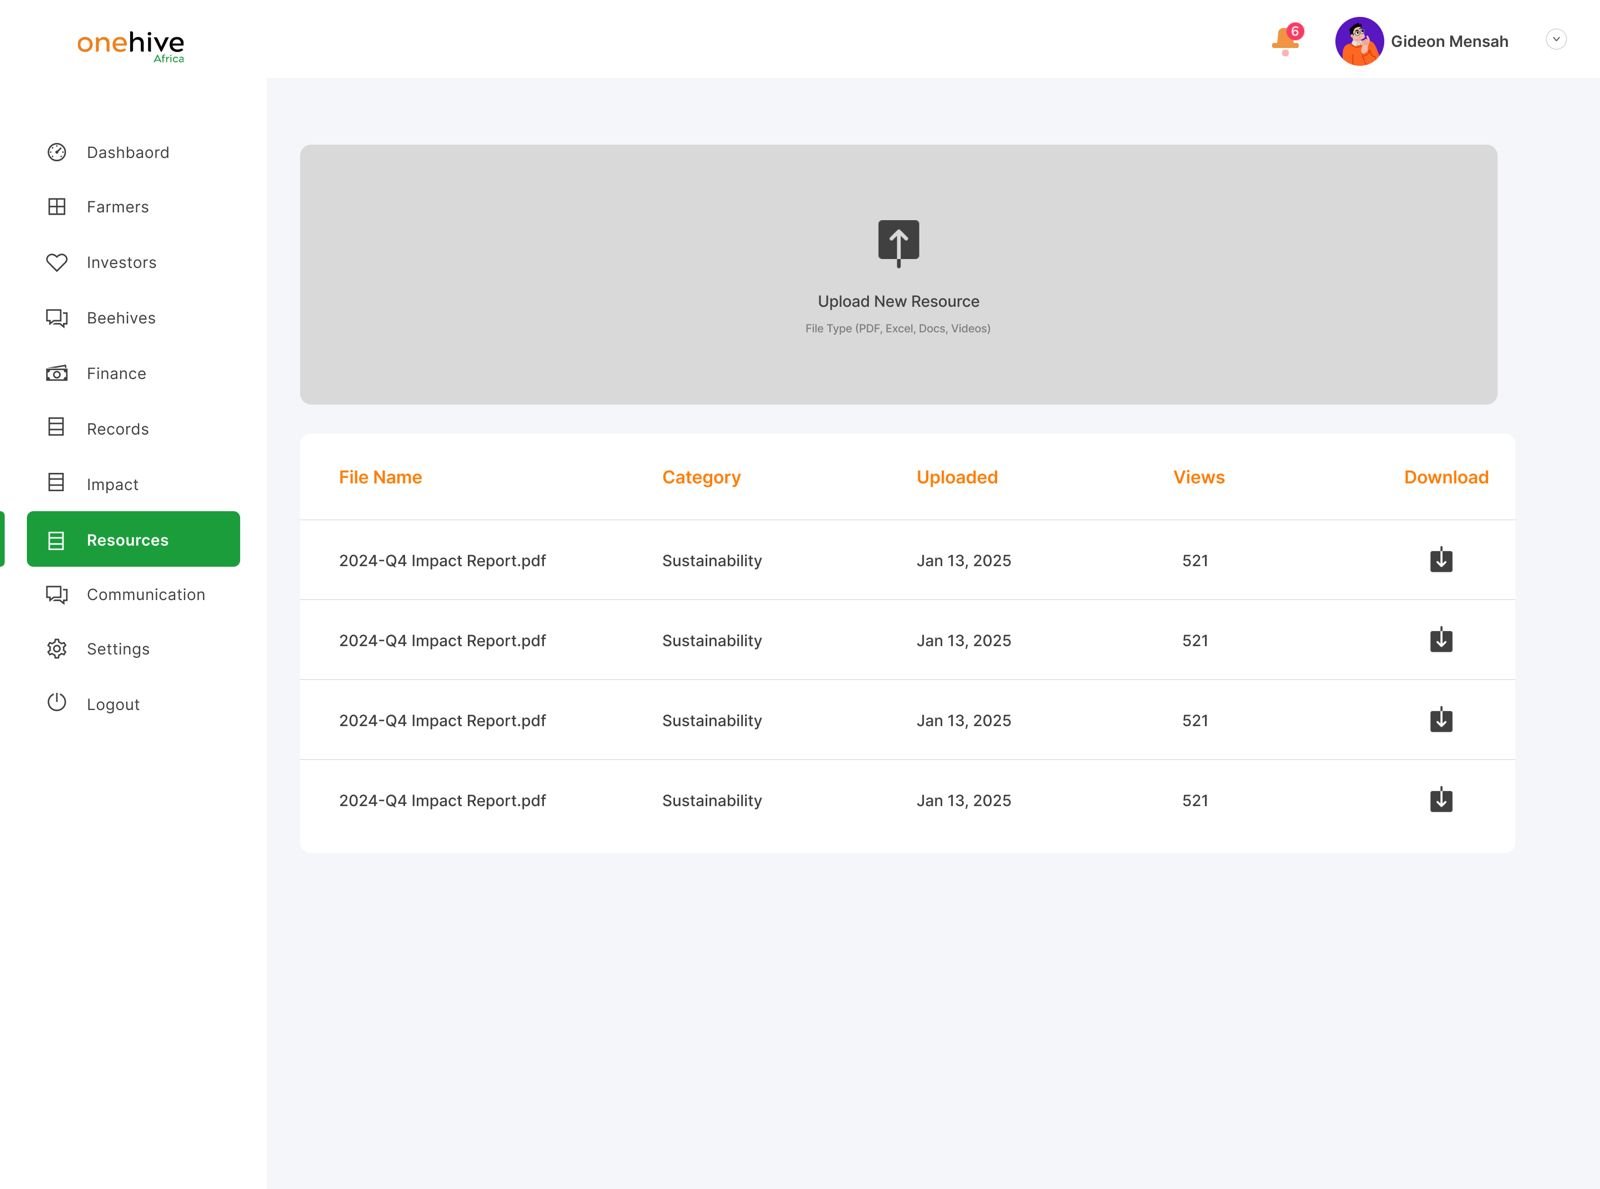
Dashboard Highlights
Investor and admin interfaces designed for clarity and efficiency
Key Features
Comprehensive tools for investors and operations teams
Investor Portfolio Dashboard
Comprehensive view of all investments with real-time tracking, ROI projections, and performance analytics.
Investment Tracking
Detailed breakdown of individual hive investments, maturity timelines, expected returns, and payout schedules.
Impact Metrics
Visual representation of environmental impact (trees planted, biodiversity) and social impact (farmers supported, communities empowered).
Admin Operations Hub
Centralized dashboard for managing investments, tracking farmer progress, monitoring inventory, and overseeing platform operations.
Farmer Management
Internal tools to onboard beekeepers, track training completion, monitor hive productivity, and manage farmer relationships.
Investment Analytics
Deep analytics for admin team including investment trends, regional performance, payout schedules, and platform growth metrics.
Real-time Notifications
Alert system for both investors (returns ready, milestones reached) and admins (pending approvals, critical updates).
Reports & Export
Automated report generation with PDF export capabilities for financial statements, impact reports, and operational summaries.
Impact & Results
Measurable improvements in transparency and operational efficiency
More Projects
Explore other brands we've designed and developed